bno08xviz
...what is this?
been hackin' on this bno08x sensor logger thingy, based on a rp2040 microcontroller.
so the bno08x sensor does neat stuff like xyz accelerometer & gyro, step and tap detection, and some motion detection like walking/climbing stairz/in a car; and some more esoteric stuff like a circle gesture.
a little electronic component that outputs a bunch of numbers over time. i'd like to think i can use this time-series data to sequence sound/music stuff. the visualizations and tools on this page are some of the things i explored along the way.
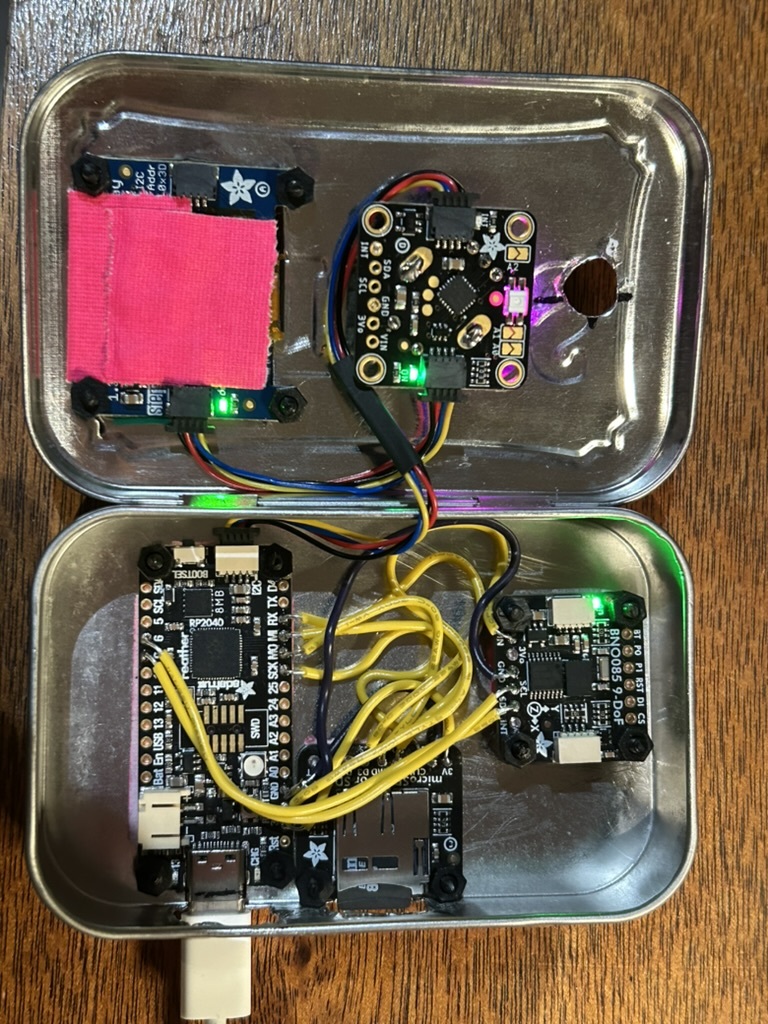
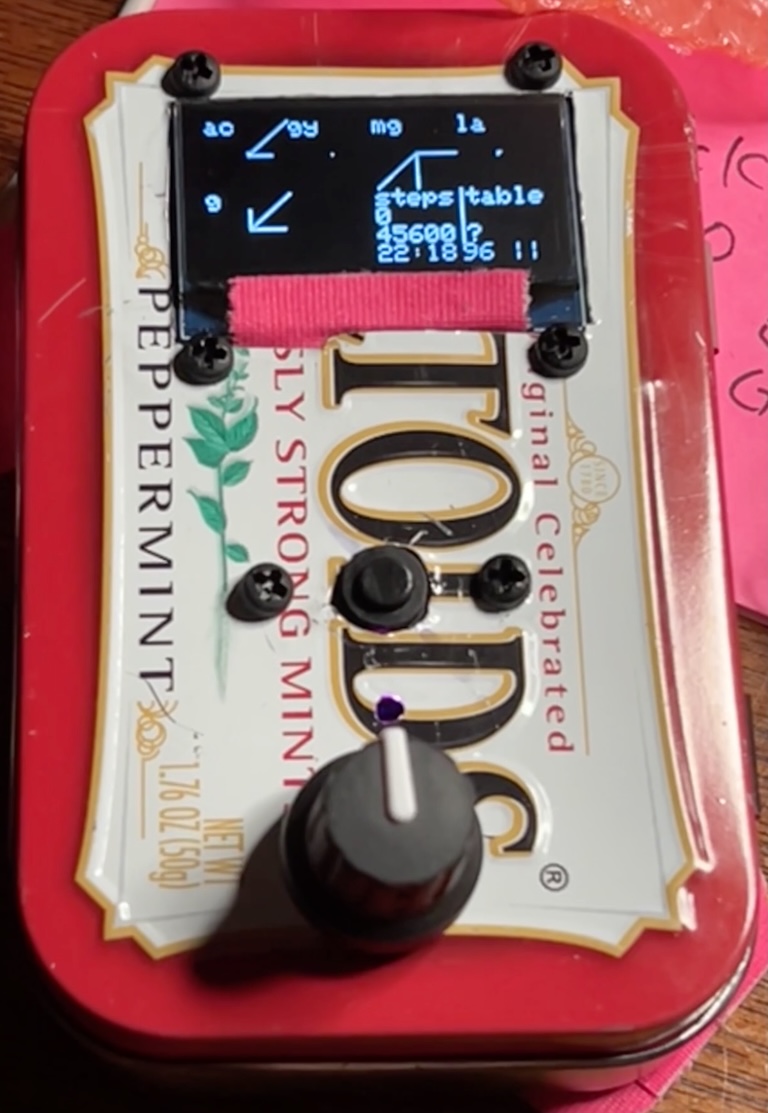
...and so now i have a bunch of adafruit stuff, stuffed inna altoids tin!
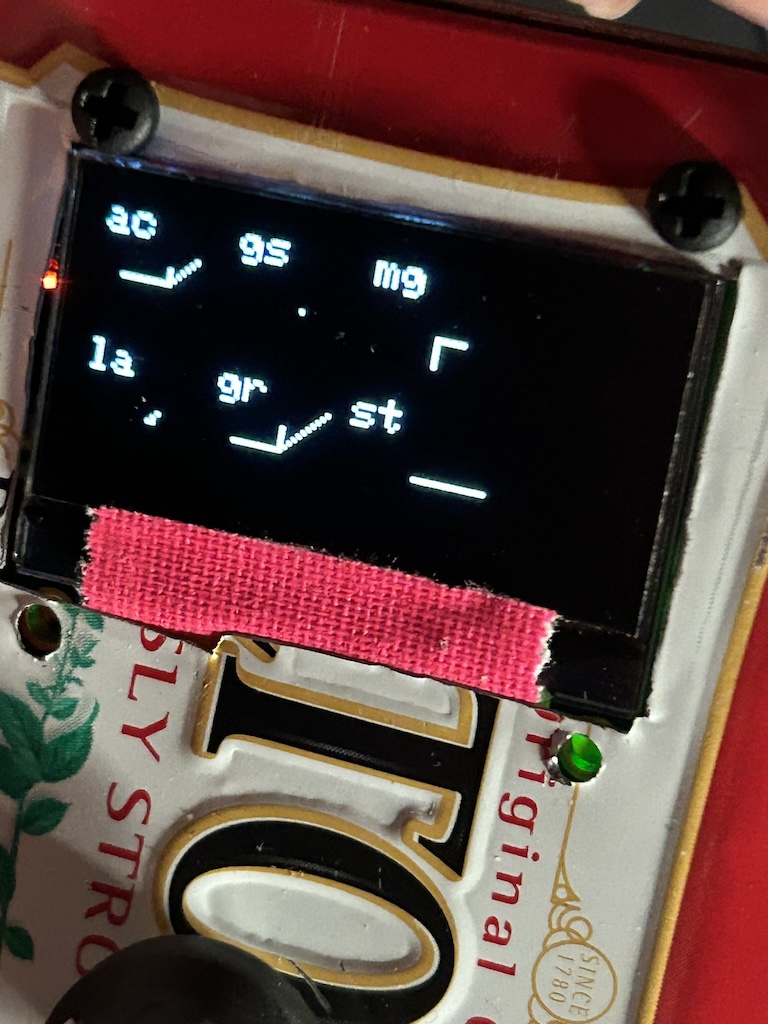
on the top of the tin is: an oled display, a power button/switch, and rotary encoder knob (also has a push button) for ui stuff. inside is a adafruit feather rp2040, the bno08x sensor, a battery (not in the picture below), a sd card for sensor logz, and a real time clock.
(square holez are hard; took two altoids tins and wayyyy longer than i expected to get it all stuffed into the tin!)
okay, so this page, here. is some d3 graphs and three.js visualizations of that sensor data.
basically what's going on here is:
- load user data file; parse each line into a shared js obj.
- d3 graph stuff to draw lines for each shared js obj key (and some html input controls)
- select some portion of the d3 graph viz, use FFT with line data to setup a web audio osc and play for 5 seconds.
- three.js 3b cube and line animation using quaternion & linear acceleration data
so, to get started with some graphs and animations, load some data from a file; either drag & drop a file onto this page, or use the file upload button below:
-- or --
try with some of these examplez: